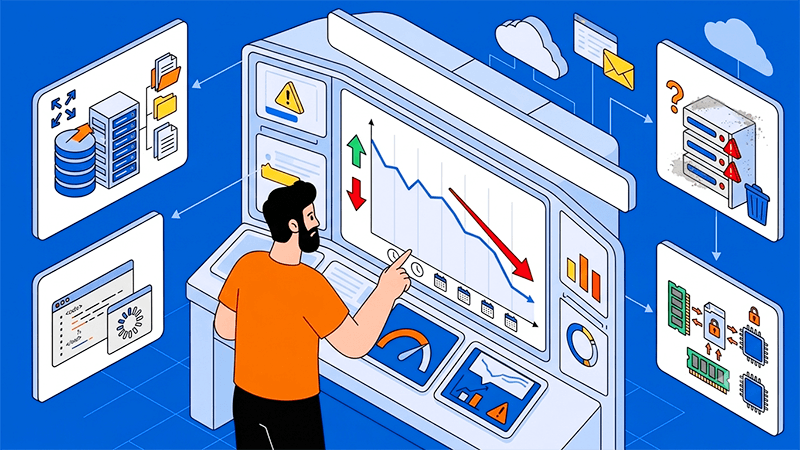
What Causes Performance Degradation Over Time?
When a production system becomes slower over time, the cause is usually not one dramatic failure. It is more often the result of small inefficiencies building up across the application, database, runtime, and infrastructure layers until the system no longer responds as smoothly as it once did. For businesses running customer-facing platforms, internal business systems, APIs, eCommerce environments, or high-traffic websites, understanding what causes performance degradation over time is essential for maintaining stability, responsiveness, and service quality.
What performance degradation over time actually means
Performance degradation is the gradual decline in a system’s speed, efficiency, or reliability as it continues operating under real production conditions. Unlike a sudden outage, it develops progressively. The application may still be online and functioning, but response times increase, resource usage rises, and routine workloads become harder to process efficiently.
In real environments, this may appear as slower API responses, longer page load times, increased CPU or memory consumption without corresponding traffic growth, slower database queries, more frequent garbage collection pauses, and a rise in timeout errors. These signs often appear well before a major incident, which is why early visibility matters.
The most common causes of performance degradation
Several causes appear repeatedly in long-running systems, and they often overlap.
Memory leaks are one of the most common reasons. When memory that is no longer needed is not released properly, the application gradually consumes more RAM. Over time, this increases garbage collection pressure and reduces overall system efficiency. In Java and Node.js environments, this can come from unclosed connections, retained objects, unused event listeners, or oversized caches that continue holding references.
Database inefficiency is another major contributor. Queries that performed well when data volumes were smaller can become serious bottlenecks as tables grow. Missing indexes, full table scans, N+1 query patterns, inefficient joins, and poorly tuned connection handling can all slow down the application. Once database response times begin to stretch, the rest of the service often starts waiting as well.
Resource contention also plays a significant role. When several services, background jobs, or containers compete for the same CPU, memory, storage I/O, or network bandwidth, performance becomes unstable. This is especially common in environments with weak resource isolation or infrastructure that no longer matches the current workload profile.
Software bloat is another common factor. As systems evolve, they often accumulate additional middleware, logging layers, integrations, feature flags, and business logic. Each change may look minor on its own, but together they increase the amount of work required for every request.
Third-party dependency slowdown can also drag performance down. If a service depends on external APIs for payments, authentication, analytics, messaging, or other core functions, delays from those dependencies can quickly affect application response times unless timeout rules, retries, and circuit breakers are designed carefully.
Tip: If response times are rising but traffic levels are relatively stable, start by checking memory behavior, query performance, and dependency latency before assuming that raw capacity is the only issue.
Why long-running systems become more vulnerable
Long-running systems naturally collect complexity. Data volumes increase, user behavior changes, traffic patterns evolve, deployment history grows, and infrastructure ages. A platform that felt fast when it first launched may perform very differently after months or years of production use simply because the conditions around it have changed.
This is what makes performance degradation difficult to manage. In many cases, the application is not broken. It is operating on top of assumptions that are no longer accurate. A database designed for modest growth may now be handling very large datasets. A server sized for earlier demand may now be carrying more background jobs, more concurrent users, and more API traffic than expected. A cache policy that once helped may now be too shallow or outdated.
Performance degradation is often a sign that the system has matured faster than the surrounding architecture.
How to detect degradation early
The most effective starting point is to establish baseline metrics. Teams need to know what normal looks like for response times, throughput, error rates, CPU usage, memory usage, and query behavior. Without that baseline, gradual decline is easy to miss.
Monitoring should go well beyond simple uptime checks. Distributed tracing helps teams see how requests move across services. Slow query logs reveal database bottlenecks. Heap analysis helps uncover memory retention issues. Resource saturation monitoring can show whether CPU, memory, storage, or bandwidth are approaching practical limits.
Synthetic checks also help because they can detect performance loss during quieter traffic periods before users begin reporting problems. It is equally useful to compare system behavior before and after deployments, since many regressions come from small code or configuration changes that only become visible under real load.
Tip: Average latency can hide a developing problem. Watch p95 and p99 closely, because degradation often becomes visible there first.
How to fix performance degradation without hiding it
The first step is triage. Confirm the level of user impact, review error rates, and check recent deployments or configuration changes. If the slowdown began immediately after a release, rolling it back may be the fastest way to restore stability.
Once the service is stable enough for investigation, teams should collect runtime evidence. Heap dumps, thread dumps, execution traces, logs, and slow query reports help identify whether the issue is coming from retained memory, database delay, contention, or dependency behavior. This matters because not every slowdown has the same root cause.
Scaling can provide temporary relief when resources are clearly exhausted, but it should not be treated as the complete answer. If the core issue is inefficient code, poor query design, or memory retention, adding more infrastructure may simply delay the next problem.
The most effective fixes often include optimizing queries, adding or refining indexes, tuning connection pools, removing memory leaks, improving caching layers, and strengthening timeout and retry controls for third-party services.
Tip: Scaling can buy time, but unresolved inefficiency usually returns as soon as traffic, data volume, or concurrency grows again.
The role of caching, storage, and runtime tuning
Some of the most persistent performance problems develop below the application logic itself. Caching, storage performance, and runtime tuning all shape how efficiently a system behaves over time.
A weak caching strategy forces the system to repeat expensive work. If frequently requested data is not cached well, the application keeps returning to the database or external services, increasing pressure across the stack. Good caching can reduce latency and absorb traffic spikes, but it also needs a reliable invalidation strategy to avoid stale or inconsistent content.
Storage performance is another overlooked factor. As logs grow, databases expand, and workloads become more write-heavy, storage latency can begin affecting application responsiveness. Slow storage often shows up indirectly through slower queries, delayed jobs, or queue build-up.
Runtime tuning matters as well, especially in JVM-based environments. Poor compaction settings can allow heap fragmentation to build up over time until the garbage collector is forced into more expensive full compaction cycles. That reduces efficiency and can create noticeable slowdowns even when the application logic itself has not changed.
When infrastructure becomes part of the solution
Not every slowdown starts in the code. In many production environments, long-term performance depends heavily on infrastructure quality. Route stability, bandwidth consistency, storage performance, and compute isolation all influence how well a system performs under sustained load.
This becomes especially important for businesses serving users across Hong Kong, Mainland China, Tokyo, Los Angeles, or other international markets. Latency-sensitive services depend on network quality just as much as they depend on efficient code. Environments with predictable resource allocation and stronger connectivity are often better suited to enterprise platforms, content-heavy websites, API-driven services, and database-intensive applications.
Dataplugs provides dedicated server, web hosting, colocation, and network solutions across key regions. For businesses reviewing how infrastructure affects long-term application performance, access to stable bandwidth, strong connectivity, and enterprise-grade hardware can support a more controlled growth path without making infrastructure the sole focus of the discussion.
How to reduce performance degradation before it becomes a production issue
Prevention is usually less expensive than recovery. Teams that want to reduce long-term degradation risk should treat performance as an ongoing operational discipline rather than a one-time launch benchmark.
That means using profiling before growth creates pressure, load testing against realistic concurrency, reviewing database behavior as datasets expand, and checking regularly whether hardware, storage, and bandwidth still match actual workload requirements. It also means ensuring observability is strong enough to catch slow drift before it becomes a business problem.
These reviews are especially valuable after feature expansion, rising traffic, architecture changes, or entry into new markets. When the platform changes, the performance strategy needs to change with it.
Conclusion
Performance degradation over time is rarely caused by one dramatic fault. It usually develops through a combination of memory leaks, inefficient queries, resource contention, software bloat, dependency delays, weak caching, storage limitations, heap fragmentation, and infrastructure that no longer fits the workload. The longer a system runs, the more likely these factors are to compound.
That is why the best approach is to detect drift early, investigate using real production signals, and correct the underlying cause before it turns into instability or downtime. For teams managing long-running systems, performance should be treated as a continuous operational responsibility. Regular monitoring, query review, memory analysis, runtime tuning, sensible scaling, and infrastructure aligned with production demand all help preserve stability over time. Visit the Dataplugs website or contact the team at sales@dataplugs.com.